
UK Home Education Statistics: What the Latest Data Shows
Two official figures for home education are in circulation and they are not interchangeable. Here is what 126,000 and 175,900 each mean, why no honest UK-wide total exists, and how much of the rise is better counting.
 Elspeth Marlow
- 13 min read
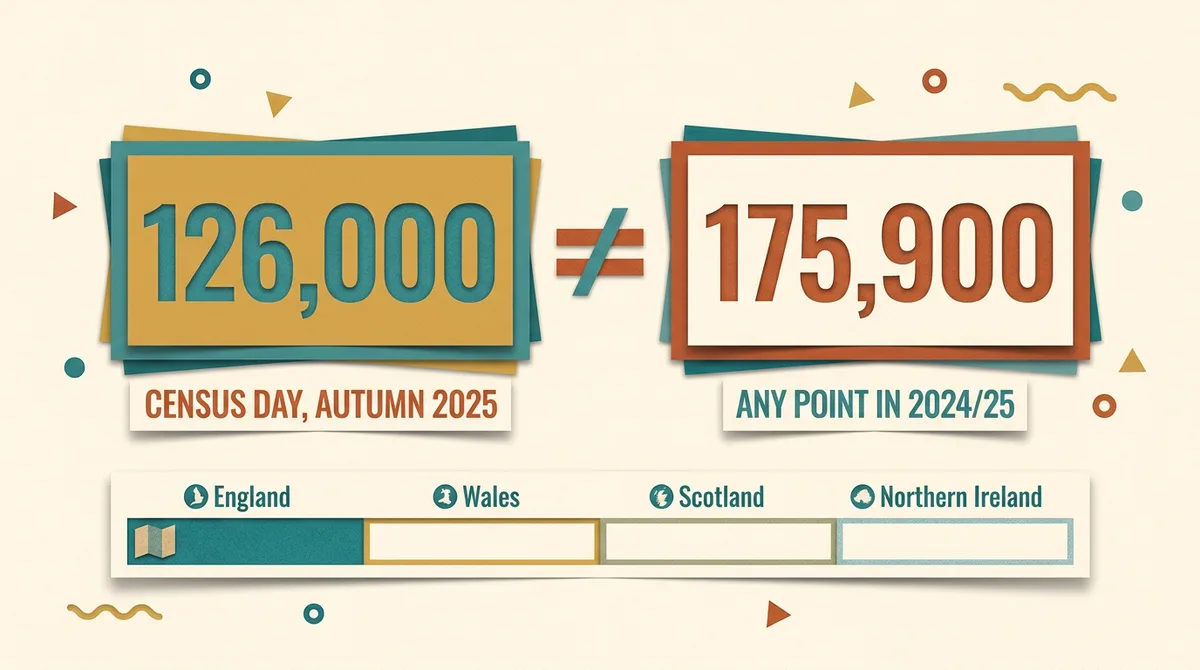
If you search for how many children are home educated in the UK, you will be given two different numbers with equal confidence. One set of pages says 126,000. Another says around 175,900. Both are official. Both are correct. They answer different questions: a count on one date and a count across the year.
Here is the disambiguation in one paragraph, because it is the only thing most readers actually need. 126,000 is the number of children whom local authorities in England knew to be in elective home education (EHE) on a single census day in the autumn 2025 term. 175,900 is the number of distinct children who were in EHE at any point across the whole 2024/25 academic year. A snapshot and a cumulative count. The second is always larger, because it includes every child who home educated for a term and then went back to school. Neither is "the number of home educated children in the UK", because neither covers Wales, Scotland or Northern Ireland.
This page is a working method rather than a list of statistics: eight steps for reading the data correctly, each with the figure you should quote, the trap that comes with it, and a worked example. All England figures come from the Department for Education's elective home education release for the autumn 2025/26 term, published January 2026. Figures below are current as of that release.
Step 1: Decide which of the two numbers answers your actual question
Before quoting anything, name the question. Snapshot questions ("how many children are being home educated right now?", "what share of the school-age population is that?") take the census-day figure: 126,000 in autumn 2025, up 14,300 on autumn 2024, equal to 1.5% of the population of comparable ages. Volume questions ("how many families used home education this year?", "how big is the potential market or caseload?") take the academic-year figure: 175,900 across 2024/25, up from 153,300 in 2023/24.
Worked example. A local paper writes: "Home education has soared to 175,900, up from 126,000." That sentence is false in a subtle way: it compares an academic-year total against a census-day snapshot, so the "rise" it reports is mostly just the difference between the two measures. The correct like-for-like pairs are 126,000 against 111,700 (autumn on autumn) or 175,900 against 153,300 (year on year). Mix the two and you invent a trend that does not exist.
Step 2: Check what the count excludes before you build an argument on it
EHE means a parent has chosen to educate a child of compulsory school age otherwise than at school, and the local authority is aware of it. Three exclusions matter.
- Education otherwise than at school (EOTAS) arranged for medical reasons is not EHE. That is the authority arranging provision, not a parent electing out.
- Children missing education (CME) is a separate count: 34,700 in England on census day autumn 2025, down 4,500 on the year, with an estimated 143,500 CME at some point during 2024/25. CME explicitly excludes children receiving suitable home education.
- Children the authority does not know about. There is currently no duty in England to notify an authority when a child has never been on a school roll, so the census-day figure is a count of known cases, not of all cases.
That third point is why the honest phrasing is "126,000 children whom local authorities were aware were in EHE", and why the Education Policy Institute has argued the true number of children missing education is far higher than the recorded 34,700, possibly nearer 300,000. If you are working out what an authority can and cannot require of you, our guide to what suitable education means in law covers the duties on both sides.
Step 3: Split the rise into behaviour and measurement
This is the step no ranking page takes, and it changes the story. The autumn EHE collection ran voluntarily from autumn 2022 and only became mandatory in autumn 2024. In the voluntary years, return rates ran between 93% and 100% of local authorities and national figures were uprated using authority pupil populations to fill the gaps. Autumn 2024 was the first term with data from 100% of authorities.
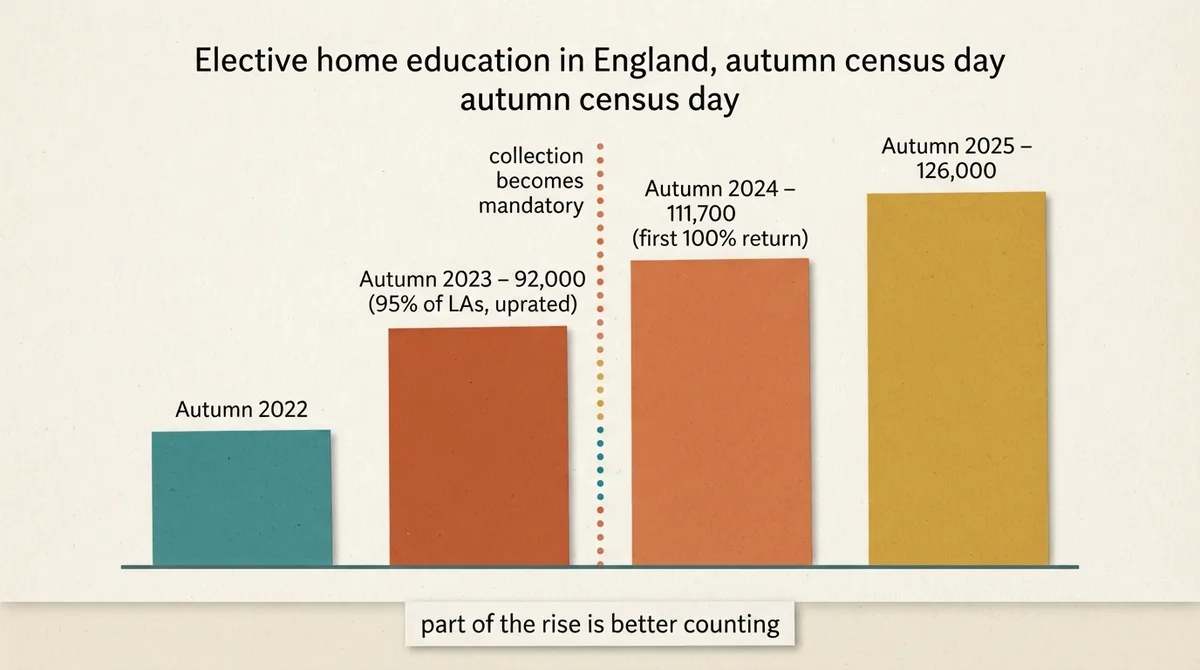
So the series 92,000 (autumn 2023, estimated from 95% of authorities) to 111,700 (autumn 2024, first 100% return) to 126,000 (autumn 2025) is not a clean 37% behavioural surge. The DfE publishes these as official statistics in development, not accredited official statistics, and states directly that changes over time are likely to be in part due to improvements in data quality.
The defensible sentence is: home education in England is rising, and an unknown share of the measured rise reflects better counting rather than more families. The autumn 2024 to autumn 2025 step (111,700 to 126,000, about 12.8%) is the most trustworthy year-on-year comparison in the series, because both endpoints come from complete returns.
Step 4: Never compare adjacent terms
Compare census counts from the same term where possible. The autumn 2025 census-day figure of 126,000 is 11,200 lower than the figure recorded at the summer 2024/25 census. Home education counts accumulate within an academic year as families withdraw children, then reset when Year 11 leavers age out of compulsory school age and a new cohort starts.
Worked example of how this gets abused. Take summer 2024/25 (137,200) and compare it to autumn 2025 (126,000) and you can write a headline saying home education has fallen 8% in a term. Take autumn 2024 (111,700) and compare it to summer 2024/25 and you can write one saying it rose 23% in two terms. Both are arithmetically true and both are meaningless. Autumn to autumn only, or year-total to year-total only.
Step 5: Read flow, not stock
The SERP treats home education as a static headcount. The data does not. During 2024/25, 78,000 children started elective home education (up from 71,500 the previous year) while 28,100 EHE children returned to a school setting (up from an estimated 21,500).
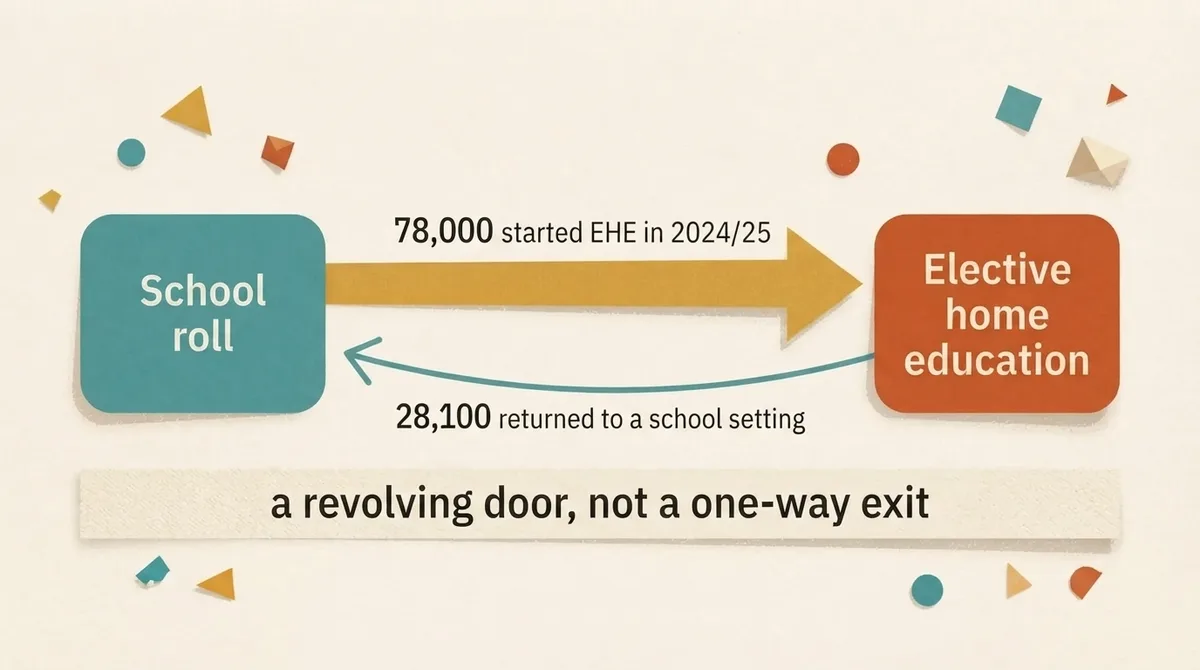
That ratio is the honest answer to "is everyone leaving school?". Roughly one return for every 2.8 starts. Home education in England is substantially a revolving door: a large minority of families use it for a defined period and then re-enter the school system. If you are planning, that has a practical consequence. Keeping a child's work in a form that maps onto national curriculum year groups makes re-entry, transfer applications and the 11 plus application sequence far easier to evidence later. Our piece on adding structure without recreating school covers how to do that without turning the kitchen into a classroom.
Step 6: Use the characteristics data before assuming your child is unusual
The autumn 2025 census records who is in EHE, and the distribution surprises most people. Of children in EHE on census day, 52% were female and 48% male. Year 11 was the single most common year group at 19% of the total; Year 1 accounted for just 3%. So home education in England skews heavily secondary, and heavily towards the final compulsory year.
On need and background: 16% were recorded as receiving SEN support and 7% had an education, health and care plan. 67% were recorded as White, with 18% unknown or refused, and English as an additional language (4%) was collected for the first time in this release.
On reasons, treat the numbers with care. The most commonly recorded primary reasons in autumn 2025 were mental health (16%) and philosophical or preferential reasons (12%), but around 30% of records had an unknown or unreported reason. When the largest single category is "we do not know", any statement of the form "most parents home educate because X" is not supported. The safe claim is that mental health is the most commonly recorded reason among cases where a reason was recorded at all. For families whose reason is SEND-related, the practical next question is usually access arrangements, which we cover in our guide to 11+ access arrangements for SEND.
Step 7: Check enforcement in your own area, because it is a postcode lottery
If an authority is not satisfied a child is receiving suitable education, it can serve a notice under section 437(1) of the Education Act 1996 requiring the parent to satisfy it, and can ultimately issue a school attendance order. In 2024/25 around 7,400 section 437(1) notices were issued in England, roughly a 6% increase, alongside an estimated 2,500 school attendance orders issued and 600 revoked.
The national totals hide enormous local variation. 22 local authorities reported issuing no section 437(1) notices at all, and 38 reported issuing no school attendance orders. Two families in identical circumstances in neighbouring authorities can have completely different experiences.
The practical step: before assuming a national norm applies to you, look up your own authority's row in the published local authority tables on the DfE release. A pair of usable ratios, both taken from the same release for the same year, is notices issued divided by EHE children known, and orders issued divided by notices issued. Against national numbers that is roughly 7,400 divided by 126,000 (about 6% of known EHE cases attracting a notice) and 2,500 divided by 7,400 (about a third of notices escalating to an order). Compute the same two ratios for your authority and you will know immediately whether you are in a light-touch area or an interventionist one.
Step 8: Stop saying "UK" when the data is England
England's figures are not UK totals. The nations publish different measures, so do not add unlike counts together.
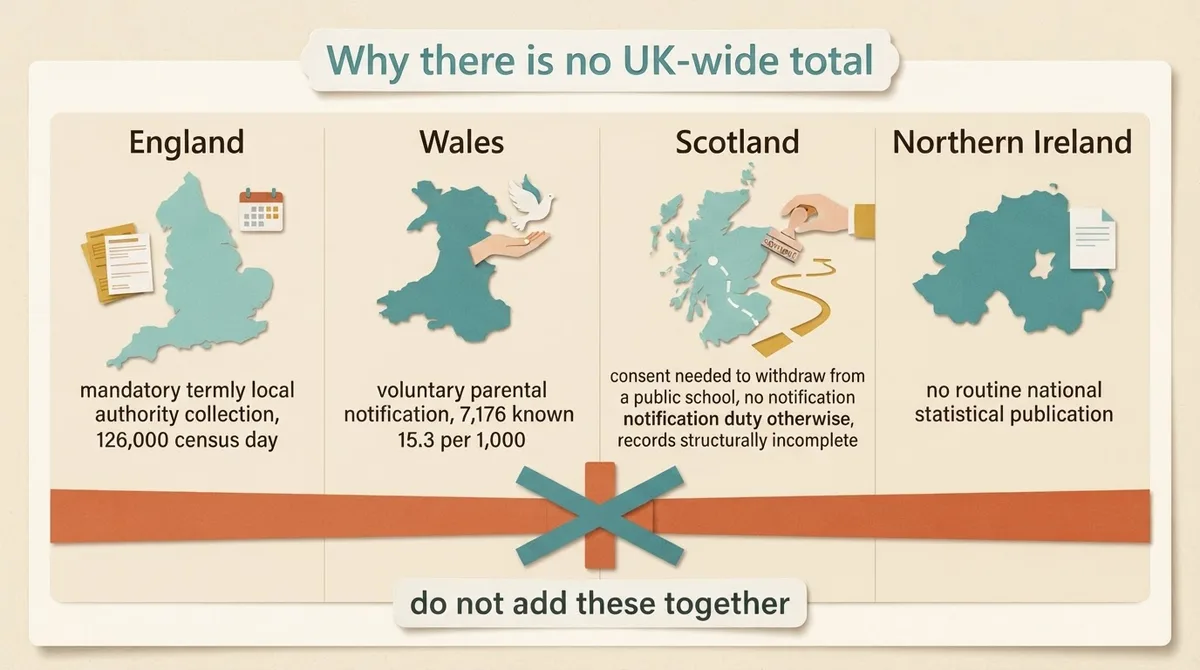
- England runs a mandatory termly local authority collection with a defined census day. That produces the 126,000 and 175,900 figures.
- Wales publishes a separate release, pupils educated other than at school, most recently on 26 August 2025. It records 7,176 children known to be home educated, a rate of 15.3 per 1,000 pupils, up from 1.6 per 1,000 in 2009/10. Crucially, home educated children are counted separately from and not included in the EOTAS total of 3,014 pupils, and the release warns that parents notify voluntarily unless they have withdrawn a child from school, so the figures "might not include all electively home educated children". Rates vary hugely by authority, with Ceredigion highest at 32.6 per 1,000. See the Welsh Government release.
- Scotland requires local authority consent before a parent withdraws a child from a public school under section 35 of the Education (Scotland) Act 1980, and consent must not be unreasonably withheld. But consent is not required where the child never attended a public school, is withdrawn from an independent school, has finished primary without starting secondary, where the school has closed, or where the child is not yet of school age. In those cases there is no statutory duty on families to notify the authority at all, so Scottish records are structurally incomplete by design. The Scottish Government guidance sets this out.
- Northern Ireland has no routine national statistical publication comparable to the other three.
Adding 126,000 and 7,176 gives you a number that mixes a mandatory snapshot with a voluntary annual notification count, then omits two nations entirely. It is a fake number. We are not going to publish one.
What the data does not say
The People Also Ask block on this query has drifted almost entirely onto outcomes: is homeschooling successful, do home educated children do well in life, does Harvard accept homeschoolers. The honest answer is uncomfortable and worth stating plainly.
No UK official dataset reports attainment or life outcomes for home educated children. The EHE releases contain counts, characteristics, reasons and enforcement activity. They contain no exam results, no destinations data, no earnings, no university entry rates. Home educated children are not on a school roll, so they do not appear in school performance tables, and there is no national tracking cohort for them.
That means claims circulating on tuition sites that home educated children "outperform by 15% to 30%" have no UK evidence base. Where such figures come from at all, they trace to self-selecting US survey samples with no comparison group controlling for family income, parental education or prior attainment. Treat any UK-badged version as unsourced.
What is known and usable: home educated children can and do sit 11+ tests, GCSEs and A levels as private candidates, and grammar school admission is governed by the test and the local admissions arrangements, not by whether a child is on a school roll. Because there is no school to produce internal assessment evidence, home educating families usually need their own record of progress over time. That is one of the few places where a structured progress tracking record does real work: it gives you a dated, objective series to show an authority, a tutor or an admissions office.
Methodology, limitations and how to check these figures yourself
Sources. England figures: DfE Elective home education release, autumn 2025/26 term, published 15 January 2026 and updated 29 January 2026, plus the prior autumn 2024/25 release for the coverage history. CME figures: DfE Children missing education release. Wales: Welsh Government Pupils educated other than at school, 26 August 2025. Scotland: Scottish Government home education guidance.
Limitations you should carry with every number on this page.
- These are official statistics in development, not accredited official statistics.
- National figures are rounded to the nearest 100 while local authority and regional figures are rounded to the nearest 10, so components will not always sum to published totals. Do not treat a small discrepancy as an error.
- Pre-2024 national figures were uprated for non-response and are not directly comparable with later ones.
- All counts are of children known to authorities.
Refresh checklist, roughly each January when the autumn release lands:
- Update the autumn census-day figure and recompute the change on the previous autumn only.
- Update the academic-year total and its own prior-year comparator, kept visibly separate from the census figure.
- Update starts and returns, and recompute the returns-to-starts ratio.
- Update section 437(1) notices, attendance orders issued and revoked, and the count of authorities reporting zero of each.
- Check whether the statistics have been reclassified from "in development" to accredited.
- Check the Welsh release separately (it runs on an August cycle) and check whether Northern Ireland has begun publishing.
- Check the Children Not in School register provisions under the Children's Wellbeing and Schools Act 2026, which received Royal Assent on 29 April 2026. It creates statutory local authority registers of children not in school and adds consent requirements where a child is subject to child protection processes or attends a special school. Once those registers are running, the known population will step up again for measurement reasons, and the same discipline in Step 3 will apply. The text of the Act is the primary source.
If you are home educating and preparing for selective entry, the data above should reassure you on one point: with Year 11 the most common EHE year group and 28,100 children returning to school settings in a single year, moving between home education and formal schooling is ordinary, not exceptional. Plan the evidence trail accordingly, and you can start building one whenever you choose.
Topics
- home education
- statistics
- school admissions
- england
- policy