
Are More Families Considering Grammar Schools? What the Evidence Shows
VAT on private school fees is real and precisely dated, but the official application data shows no national grammar school surge. Here is how to tell which claims hold up, and what actually decides whether your child gets a place.
 Elspeth Marlow
- 14 min read
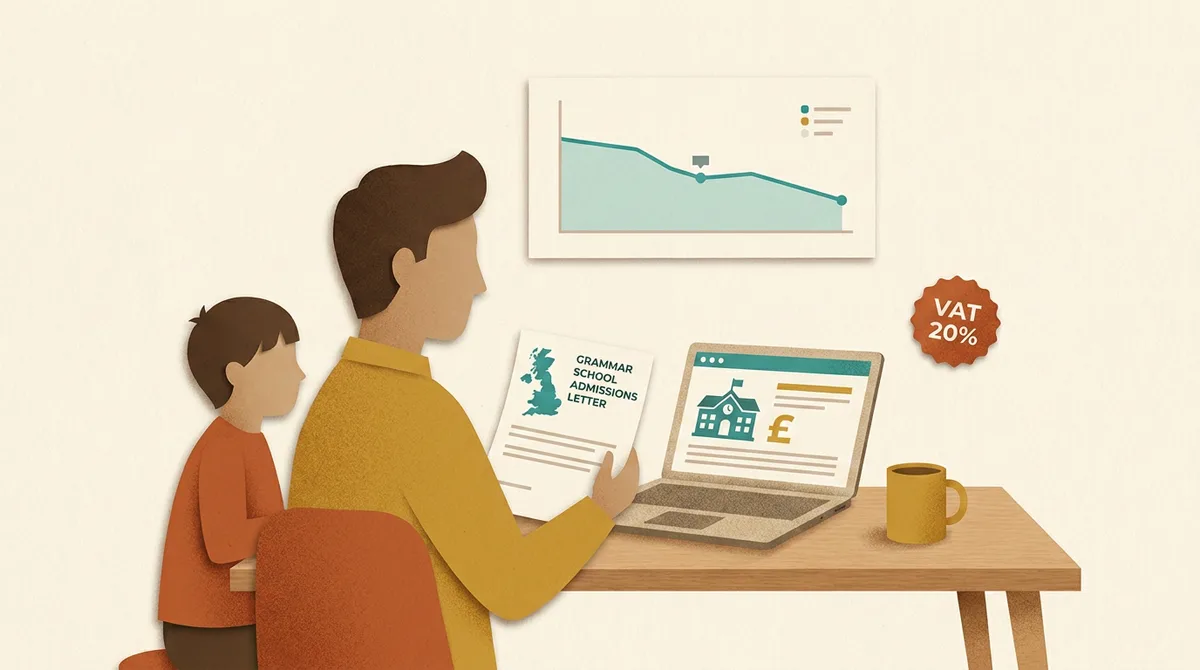
Since VAT was applied to private school fees, one confident story has circulated: families are leaving the independent sector in large numbers, grammar schools are being swamped, and the 11+ is about to become dramatically harder. Tutoring companies repeat it. Some newspapers amplify it. Campaign groups rebut it. Almost nobody shows a parent how to work out which parts of it are actually supported.
The short answer is that the policy changes are real, precisely dated and slightly larger than most coverage admits, but the national application data does not show a grammar school surge. Secondary school applications in England for September 2026 entry fell by 1.3%, and the share of families receiving their first-preference offer rose. Independent school numbers are falling, but so is the whole school-age population. Both things are true at once, and only reading them together gives you an honest picture.
What follows is deliberately tiered. Confirmed policy is separated from official statistics, official statistics are separated from local structural pressure, and all three are separated from anecdote. The payoff at the end is the part the rest of the search results miss entirely: whether your child gets a grammar place is decided by your local test, your local qualifying standard and your school's oversubscription criteria, not by the national mood.
What changed in policy, and exactly when?
Three changes matter, and their dates are not in dispute.
- VAT at 20% from 1 January 2025. All education and boarding services provided by a private school or connected person became subject to VAT at the standard rate (gov.uk guidance).
- Anti-forestalling from 29 July 2024. Pre-payments made on or after that date, relating to terms starting on or after 1 January 2025, are also taxable at the standard rate. This closed the "pay five years upfront" route that circulated in mid-2024.
- Business rates relief removed from 1 April 2025. In England, private schools that are charities no longer receive charitable relief on business rates. The government identified 1,024 schools losing eligibility, and estimated the average increase at £308 per pupil in 2025-26, ranging from £186 in the North East to £361 in the South East. Schools wholly or mainly educating pupils with an Education, Health and Care plan are exempt (business rates policy paper).
The second and third points are routinely dropped from tutoring-site summaries, which is a shame, because the business rates change is the one most likely to affect smaller day schools with modest reserves.
On size of effect, the government's own published expectation is that fees rise by around 10%, not the full 20%, because schools absorb part of the cost. It forecast 37,000 fewer pupils in the UK private sector in the long run (about 6% of the private school population), with roughly 35,000 moving into state schools, and stated that it expects "the vast majority (94%) of pupils currently in private schools to remain in private schools".
To see what a fee quote adds up to across secondary school, enter it below with the rise your school has actually made in recent years. It only adds VAT if your quote leaves it out.
This part of the guide adds up private secondary school fees over five or seven years with yearly rises. It works in your browser.
How should you weigh claims about grammar school demand?
Use four tiers, and refuse to let a claim move up a tier just because it is repeated loudly.
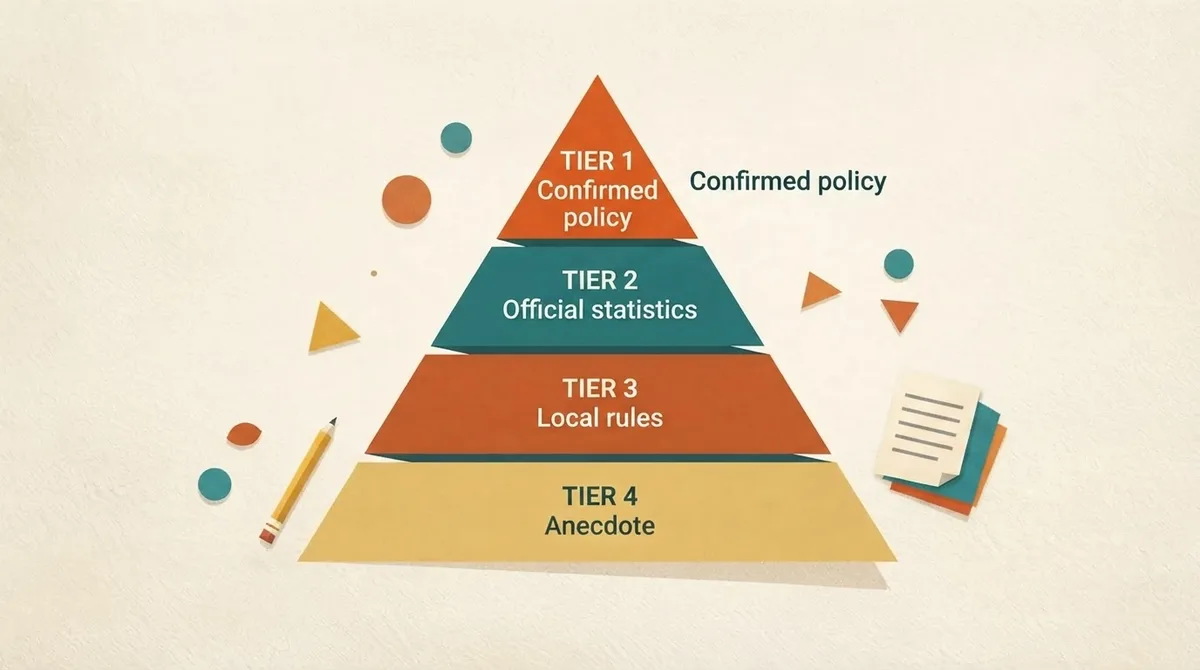
- Tier 1, confirmed policy. Rates, dates and legal mechanisms published on gov.uk. Treat as fact. The three changes above sit here.
- Tier 2, official statistics. Department for Education releases with named publication dates and methodology. Treat as fact, but read the DfE's own caveats, because they usually explain the cause.
- Tier 3, local and structural. Council admission arrangements, individual school oversubscription criteria, published test formats and qualifying standards. Verifiable, but they only apply to your area.
- Tier 4, anecdote and advocacy. Tutor-reported demand, single-school applicant ratios, closure counts from opinion sites, and quotes from membership bodies. Useful as a signal of mood. Not evidence of a trend.
A quick worked example of the tiers in action. The claim "grammar schools now see over 30 applicants per place" is a Tier 4 statement when it appears without a named school and year, because ratios of that kind are usually raw application counts against places at one very well-known school, and the same child appears in several schools' counts. The claim "secondary applications fell 1.3% for 2026 entry" is Tier 2, because it is one national release with a stated denominator. When they conflict, Tier 2 wins.
What do the official pupil and application numbers actually show?
Two DfE releases carry most of the weight here.
The January 2026 school census recorded pupils in independent schools in England falling 3.8% to 560,300, "declining for the second consecutive year", now 6.3% of the school population. Over the same period total pupil numbers fell by 112,200, or 1.2%, to just over 8.9 million, which DfE attributes to "demographic changes, following a peak of births in 2012" (school pupils and their characteristics).
Read those two figures side by side. The independent sector is shrinking about three times faster than the population as a whole, so something beyond demography is happening there. But the demographic backdrop is not nothing, and any page that quotes 3.8% without quoting 1.2% is showing you half a subtraction.
Now the demand side. For September 2026 entry, published on 18 June 2026, secondary applications in England fell by 1.3% since 2025. First-preference offers rose to 83.6% from 83.5%, and any-preference offers to 96.4% from 96.3%. Applications peaked in 2023 at 619,991, when the 2016 primary peak rolled through, and there have been year-on-year decreases in both applications and places available since (applications and offers 2026-27).
That is the honest reading, and it is uncomfortable for both camps. Fewer children are in private schools than two years ago. And there is no national surge in secondary applications, with more families getting their first choice, not fewer.
Are private schools closing, and is that unusual?
Closures are real, and they are also normal. The government's own analysis states that "in recent years, around 3% of private schools have closed each year". It also notes that since 2000, average fees rose 75% in real terms while pupil numbers and total school numbers stayed stable, across a period that averaged 74 closures and 83 new openings each year in England. Its estimate was that roughly 100 additional schools may close over three years before closure rates return to historical norms.
So when you see a headline closure count, the question is not "how many closed?" but "how many more than the 74-a-year baseline?" A count of 100 closures in a year is above trend but not a collapse. Counts published by opinion outlets without a baseline, a definition of "school" or a comparison year should stay in Tier 4 until a named statistical source confirms them.
For scale on the state side, the government framed the transfer as around 35,000 pupils across the UK, described as "less than 0.5% of the pupil population", against a system where 83% of primary schools and 77% of secondary schools had one or more unfilled places. The business rates measure was separately estimated to produce 3,100 fewer private pupils, with about 2,900 moving to state schools.
Why can national figures still hide real local pressure?
Because selective areas are a minority of England, and averages across a mostly comprehensive country will always flatten them.
Think about the arithmetic in a single selective district. Grammar school places are close to fixed: a school with a published admission number of 150 admits 150, whatever happens to applications. If a district has 2,000 children in the cohort and 40 of them move out of the independent sector into the state system, applications for those fixed places rise by a couple of per cent even while the national figure falls, because the local independent share was much higher than the national 6.3% to begin with. Areas with a high concentration of prep schools feeding a small number of grammars can therefore feel busier while the country as a whole is quieter.
The reverse also happens. In districts where the post-2012 birth decline bites hardest, the same fixed supply of grammar places meets a smaller cohort, and the effective standard can soften slightly. Buckinghamshire, Sutton and Trafford will not move together, because their cohorts, their tests and their catchments differ. Use the Trace Learn grammar-school directory to compare each published school's reviewed route and allocation evidence rather than carrying one area's rule into another. If you are comparing schools, the grammar-school league table provides sourced Attainment 8 context while explaining why selective intake is not the same as school-added progress.
The Grammar School Heads Association has been reported as saying it has seen no significant increase in applications. Treat that as an attributed statement from a membership body, not as a national statistic. It points the same way as the DfE data, which is worth noting, but it is not the same class of evidence.
Why is passing the 11+ not the same as getting a place?
This is the distinction that turns a panic query into a plan, and it is stated plainly by the councils themselves.
The London Borough of Sutton says that "success in tests or assessments for any of these schools does not guarantee an offer of a place". Six schools there share a selective eligibility test (Greenshaw High School, Sutton Grammar School, Wallington County Grammar School, Wallington High School for Girls, Nonsuch High School for Girls and Wilson's School), and passing it only qualifies a child to sit second-stage entrance examinations. Most registrations for that shared test close on 31 July, months before the 31 October common application deadline (Sutton secondary tests and assessments).
Buckinghamshire works differently again. The council states that children who achieve a score of at least 121 in the Secondary Transfer Test "are considered qualified for a Buckinghamshire grammar school". Qualification is a gate, not an allocation: each school then applies its own oversubscription criteria, which typically rank looked-after children, then siblings, then distance. Two children can both score 124 and only one gets the school they wanted, purely on distance.
Essex adds a third pattern. The Consortium of Selective Schools in Essex runs the exams, but states that it has no involvement in school applications, admissions or appeals. The body that tests your child and the body that offers a place are not the same organisation.
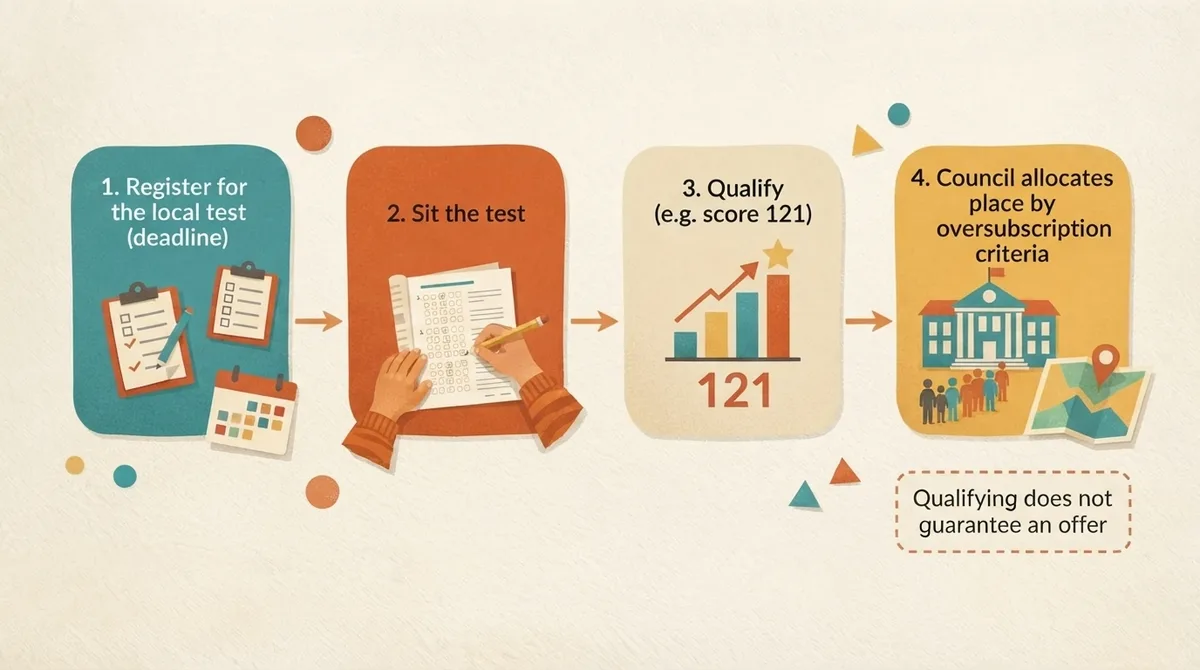
So the practically correct answer to "is it harder now?" is: the binding constraint is your local allocation rules, not the national mood. Our guide to what grammar schools select for walks through how the criteria stack up in practice.
What does a qualifying score like 121 actually mean?
It is not a percentage. Qualifying standards are expressed as standardised age scores, which GL Assessment, the test publisher, describes as converting "a pupil's raw score to a standardised score which takes into account the pupil's age in years and months", giving an indication of performance "relative to a national sample of pupils of the same age", with an average of 100. GL calls it "the fairest way to compare performance of different pupils within a year group" (guide to standardised tests).
Two practical consequences. First, a September-born and an August-born child with identical raw marks will receive different standardised scores, because age weighting adjusts for the months between them. Second, you cannot convert 121 into "you need 82% correct", because the raw mark needed shifts with paper difficulty and cohort performance each year. Our guide to what grammar schools select for shows how that score is used after marking.
Buckinghamshire's test is two multiple-choice papers: one testing verbal skills (comprehension, technical English and verbal reasoning), one testing maths together with non-verbal and spatial reasoning. Other areas test different combinations, and some include written English. Check your own area's published format rather than assuming.
If your school plan has changed, what should you do next?
Start with a five-line factual audit, not with more practice papers. For your specific area, write down:
- Which test your target schools use, and who administers it.
- The registration deadline, which is often in the summer term and is separate from the 31 October application deadline.
- The qualifying standard or eligibility rule, and whether there is a second stage.
- Each school's oversubscription criteria, in order.
- Your realistic distance position, using last year's published furthest-distance-offered figure if the school releases one.
Missing a registration deadline is the single most common self-inflicted failure in this process, and no amount of preparation recovers from it. The practical parent guide to the 11 plus covers the application sequence.
Then a calm plan by year group:
- Year 4. No 11+ material required. Build reading volume, times tables to instant recall, and written fluency. Twenty minutes of reading a day compounds more than any workbook at this stage.
- Year 5, autumn. Confirm the audit above. Begin light familiarisation with the question types your area actually uses, roughly two short sessions a week. Diagnose gaps rather than drilling everything.
- Year 5, spring and summer. Register by the deadline. Move to timed sections, then a first full paper under proper conditions. This is where progress tracking earns its place: you want to know which topics are genuinely weak, not which felt hard.
- Year 6, up to the test. Full mock tests at a steady cadence, spaced out rather than stacked, with review time built in after each. Protect sleep and normal activities in the fortnight before.
Notice what is absent: any instruction to increase weekly tutoring hours because of VAT. Nothing in the policy changes altered what the tests assess.
If you miss out, what are waiting lists and appeals really worth?
Be realistic, and act on both routes at once.
Waiting lists are usually the higher-probability route. In most areas, a council must maintain a secondary waiting list ranked by the school's oversubscription criteria, not by application date, and movement happens through the spring and summer as families decline offers. Ask the admissions team where your child currently sits and how far the list moved last year.
Appeals are a real route, but a minority one. DfE data published on 6 August 2026 shows 34,800 secondary appeals lodged (about 4.7% of secondary admissions), 27,100 heard (3.6% of new admissions) and 5,300 successful, which is 19.5% of those heard. Appeals heard fell from 29,600 in 2025 (admission appeals in England).
Roughly one in five heard appeals succeeds. That is a genuine route worth preparing properly for, and a poor thing to rely on as a backstop.
Grammar appeals have an extra hurdle: for a selective school you generally have to show the panel that your child is of the required academic standard, in addition to the usual case. Independent evidence such as school reports, teacher statements or documented illness on test day carries more weight than parental assessment. The grammar-school appeals tool explains the qualification and oversubscription stages, evidence and limitations.
And keep the alternatives properly in view. A good non-selective place taken willingly usually beats a selective place chased anxiously, and later entry points exist at 12+, 13+ and sixth form in many areas.
The bottom line for parents
The policy is confirmed and dated. The national statistics show falling independent numbers alongside falling, not rising, secondary applications. Local pressure is real in specific selective districts, but it is created by fixed place supply meeting an uneven cohort, not by a countrywide stampede. The claims that would justify panic sit in Tier 4, unnamed and undated.
What you control is the audit, the deadline and the preparation. If you want a structured way to run that preparation without turning your household into a cramming operation, you can start with a free account and build the plan around your area's actual test.
Topics
- grammar schools
- admissions
- private school vat
- school places
- appeals