
 Length 2:19
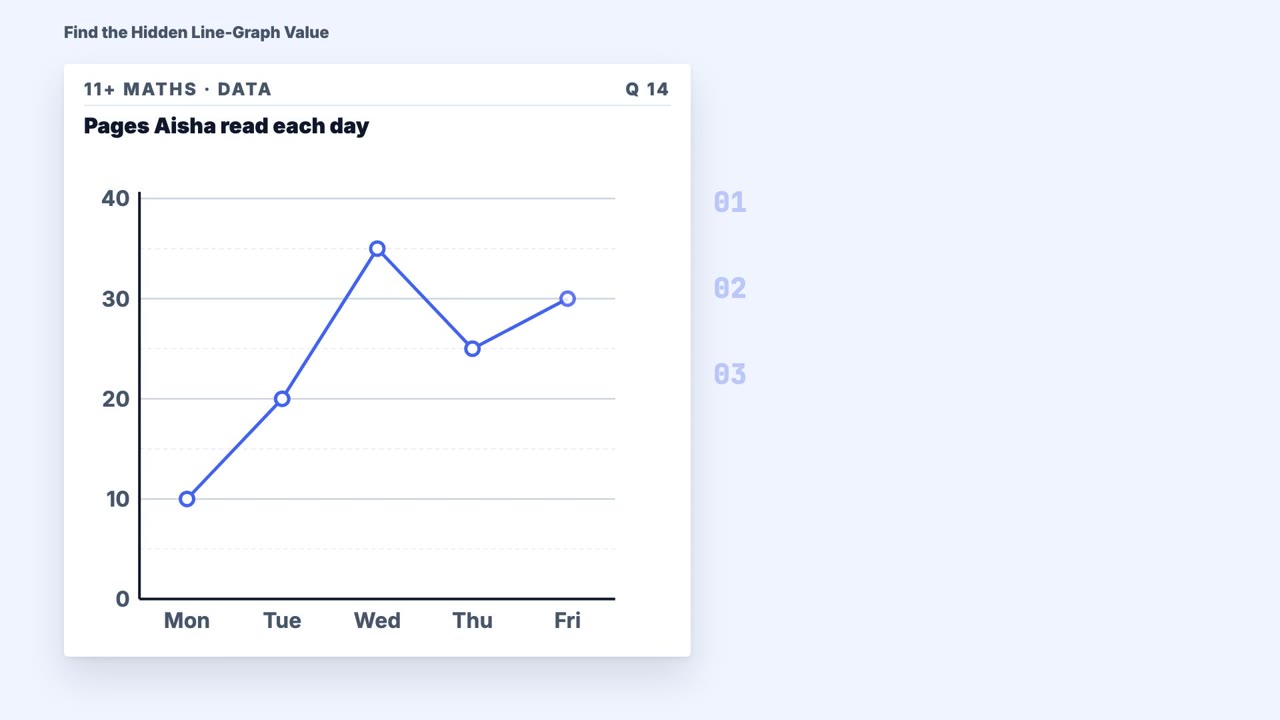
Find the Hidden Line-Graph Value
Read a line-graph value
11+ Maths · Data
A short worked example (2:15) for one 11+ maths skill: Read a bar-chart value.
This video shows how to use the scale and category labels to find the value represented by one bar. Watch an 11+ maths question solved step by step.
Turn on captions with the CC button. The full transcript is below the video.
Every word of the video, to read along or to skim before watching.
This bar reaches seven grid lines, so its value must be seven... right? Not so fast! One tiny detail can completely change the answer. Crack that detail, and you can read any single bar with confidence.
First, find the category named in the question. Look along the category axis, then trace straight from its label to its bar. Keep your eyes on THAT bar. Do not jump to a neighbouring row or column, even if its bar looks more noticeable. Next, decode the scale. Read two neighbouring numbers on the value axis. Here they are ten and fifteen. The difference is five, so each grid interval is worth five. You are not counting lines as single units. You are counting in steps of FIVE. Now find the top of your chosen bar. Trace across to the value axis without drifting up or down. The Skipping bar meets the line marked twenty-five, so the value for Skipping is twenty-five children. Category, scale, value. That is the route.
Now let's try this example. The bar chart shows books borrowed from a library on different days. How many books were borrowed on Thursday? Start with the named category. Find Thursday along the bottom... and lock onto the bar directly above it. Before reading the bar, check the scale. Two neighbouring labels are twenty and thirty, with one grid interval between them. Thirty minus twenty is ten. So that interval represents ten books. Do not call it one just because you crossed one square. Trace across from the top of Thursday's bar. It lands exactly on forty. So the answer is forty books. Notice what you did: you chose the correct category, decoded the scale, then read the value. Clean and precise!
Whenever you read one bar, remember: find the named category, work out what each interval is worth, then trace from the bar to the value axis. Never assume one square means one unit. You have cracked the scale... and the answer!
Watch these next. The first ones teach the skills closest to this one.
Length 2:19Read a line-graph value
 Length 2:28
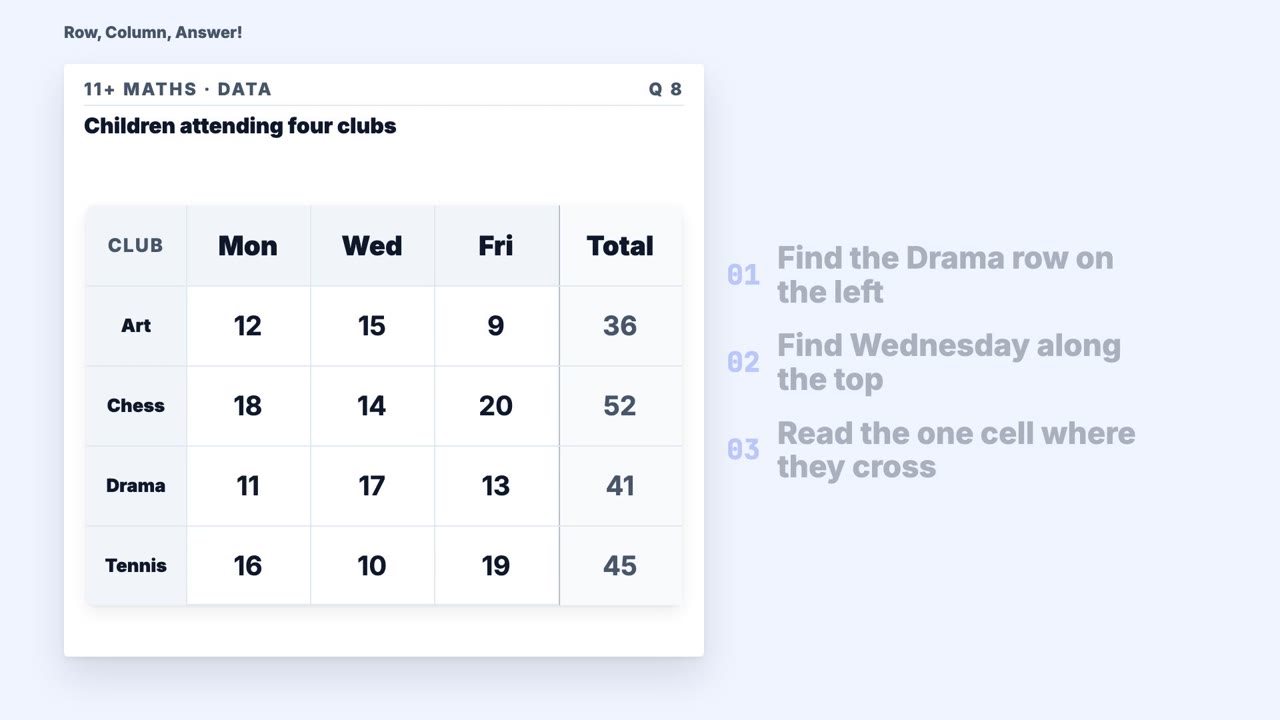
Read a table cell
 Length 2:30
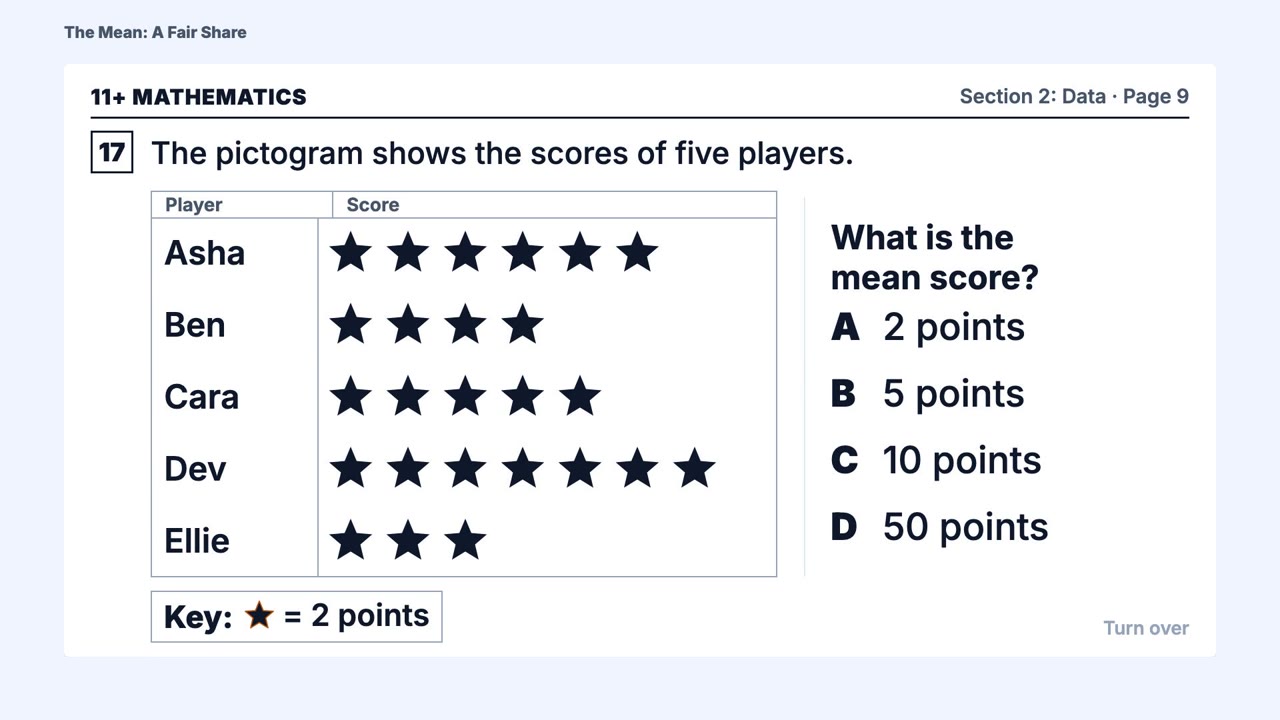
Calculate an arithmetic mean
The free diagnostic checks maths, English and both kinds of reasoning, and shows what to practise next. No card is required.