
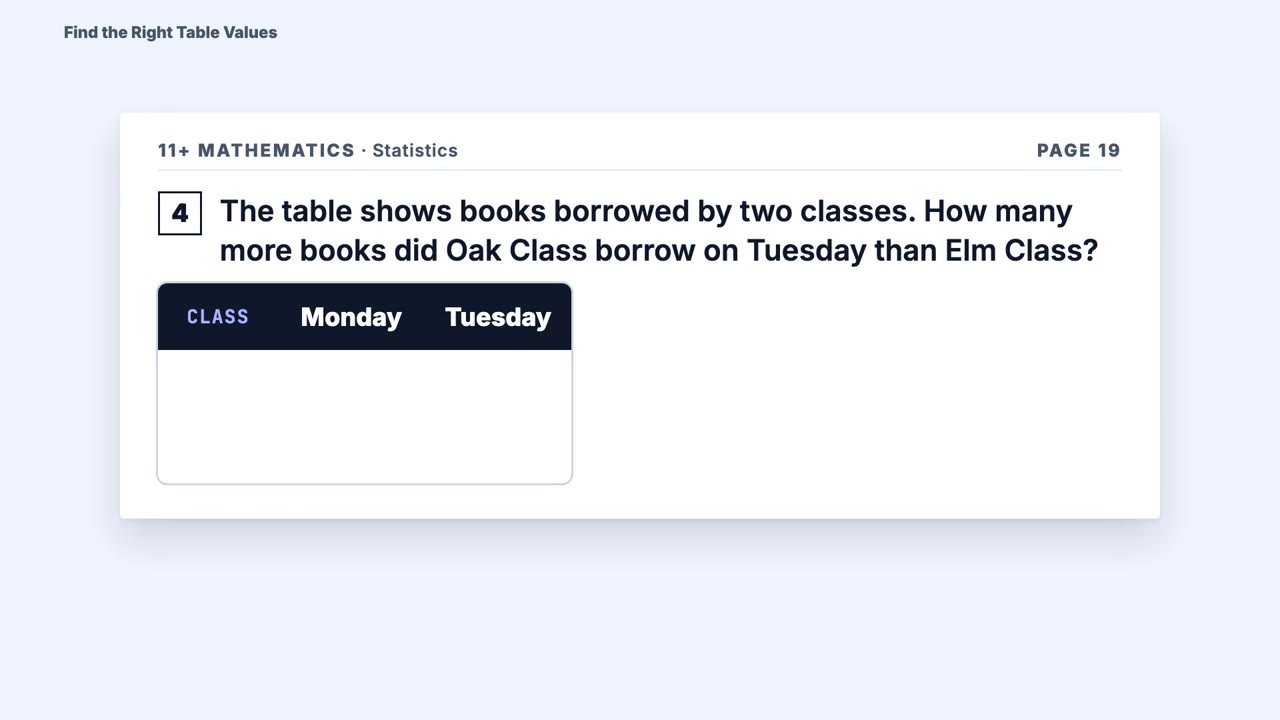
 Length 2:38
Find the Right Table Values
Compare table values
11+ Maths · Data
A short worked example (2:42) for one 11+ maths skill: Compare line-graph change.
This video shows how to read plotted values and calculate a rise, fall or gap between points on a line graph. Watch an 11+ maths question solved step by step.
Turn on captions with the CC button. The full transcript is below the video.
Every word of the video, to read along or to skim before watching.
Two lines can finish at the same height... yet one can make the much bigger leap. How can a graph reveal the winner without tricking your eyes?
First, find the two plotted dots named in the question. Trace each dot straight across to the number scale. Read the VALUE, not just its height. Here, the first dot is at twenty, and the second is at thirty-five. Now decode the scale before counting. These labels rise by ten, and there is one smaller interval between them, so each interval means five. Five, not one. Counting grid spaces as single units would give the wrong values. To find a change, subtract the earlier value from the later value. A rise from twenty to thirty-five is thirty-five subtract twenty, which is fifteen. On screen, the vertical gap is bracketed from twenty up to thirty-five. The bracket shows the change, not a new plotted value.
Let's work through an example. A line graph shows the number of visitors to a wildlife centre at noon on four days. The plotted values are: Monday, forty; Tuesday, fifty-five; Wednesday, thirty; and Thursday, fifty. How much greater is the increase from Wednesday to Thursday than the increase from Monday to Tuesday? Start with Monday to Tuesday. The line moves from forty to fifty-five. Subtract forty from fifty-five. That increase is fifteen visitors. A blue bracket locks onto those two dots and is labelled fifteen. Next, use Wednesday to Thursday. The line climbs from thirty to fifty. Subtract thirty from fifty. That increase is twenty visitors. An amber bracket appears beside the first, stretching five visitors farther. Now compare the changes themselves: twenty minus fifteen equals five. So the Wednesday-to-Thursday increase is FIVE visitors greater. Notice that we matched the named days along the bottom first, then read their values from the side scale. We did not swap the axes.
Find the named dots, decode the scale, subtract to get each change, then compare those answers. Keep your eyes on the labels and you will read every line graph with confidence!
Watch these next. The first ones teach the skills closest to this one.
Length 2:38Compare table values
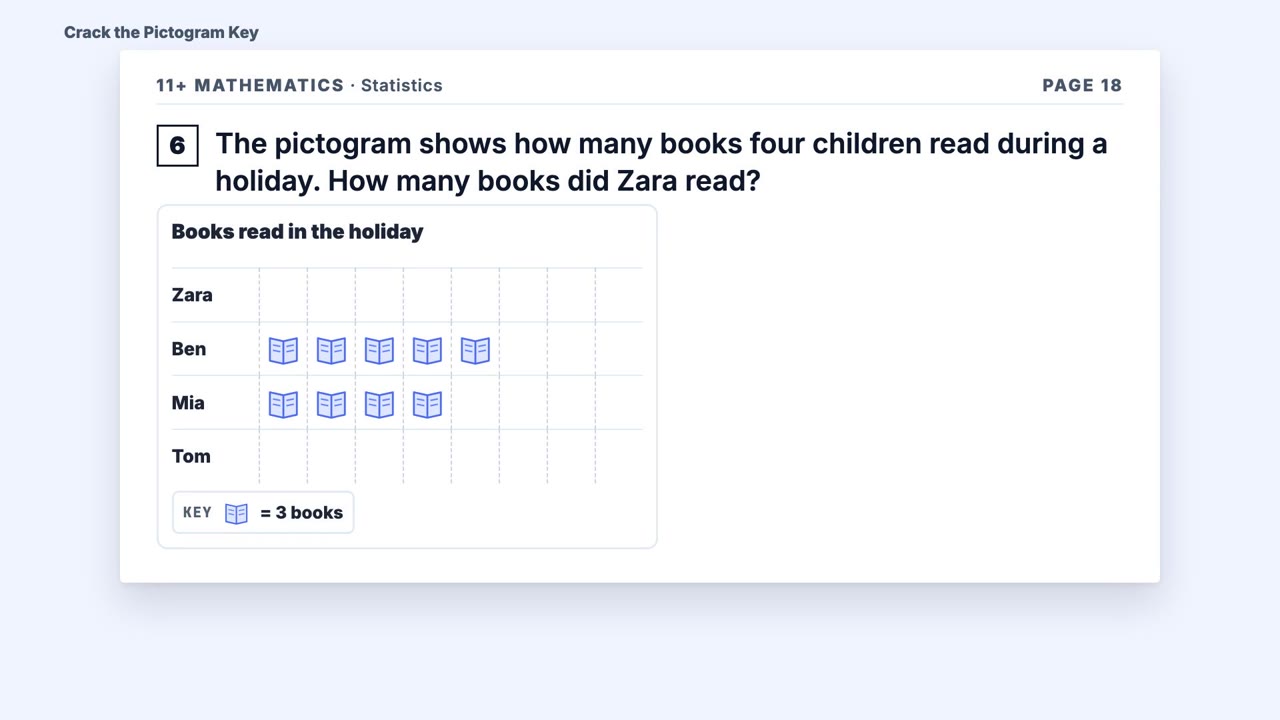 Length 2:34
Decode a pictogram key
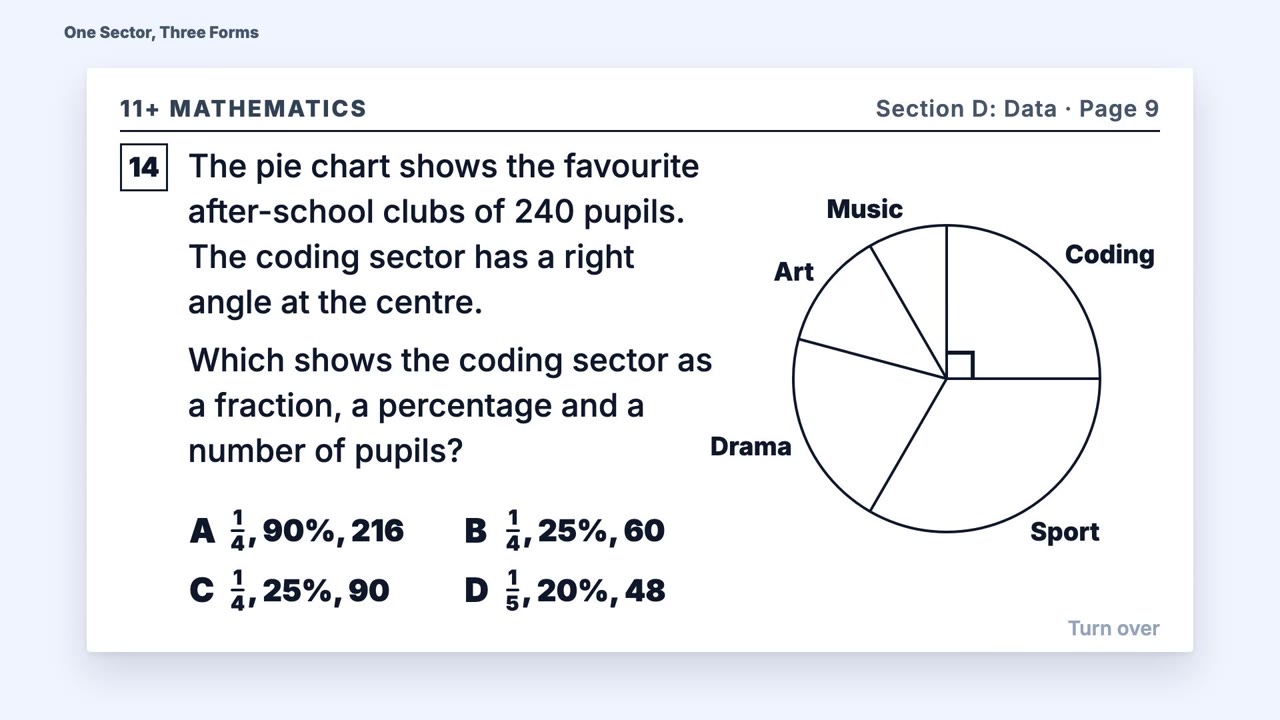 Length 2:30
Interpret a pie-chart sector
The free diagnostic checks maths, English and both kinds of reasoning, and shows what to practise next. No card is required.